
Quick start: your first drawing in ten minutes
From a new account to points on a drawing, a surface, and a plotted PDF, the short version.
6 min read
Before you start
You need two things: a coordinate system your work is on, and some data, a points file, a DXF, a LAS, or nothing at all if you are drawing from scratch. Everything else can wait.
Bring a points file if you have one
A CSV of point number, northing, easting, elevation and description is the fastest way to see Backsight do something useful with your own data.
1. Make a project
- Sign in and choose Projects → New project.
- Give it a name and a project number.
- Choose the coordinate system your survey is on. This is the one decision worth slowing down for, see Choosing a coordinate system.
- Choose a vertical reference. If you are on an assumed datum, say so; it travels as a label on everything you produce.
- Save. The project opens in the workspace.
Note
A project carries its own grid, drawings, points, surfaces, imagery, clouds and locates. Everything inside it lives on that grid.
2. Get your data in
Whichever you have:
- Points: Import (top bar) → Survey points. Map your columns, check the preview, import.
- A drawing: Import (top bar) → DXF or LandXML drawing, or LandXML for surfaces and alignments.
- A point cloud: Import (top bar) → Point cloud. LAS, LAZ, E57, PLY or XYZ/PTS.
- Drone photos: Drone mode → a mission, then upload the flight.
- Nothing: skip to the next step and draw.
3. Draw something
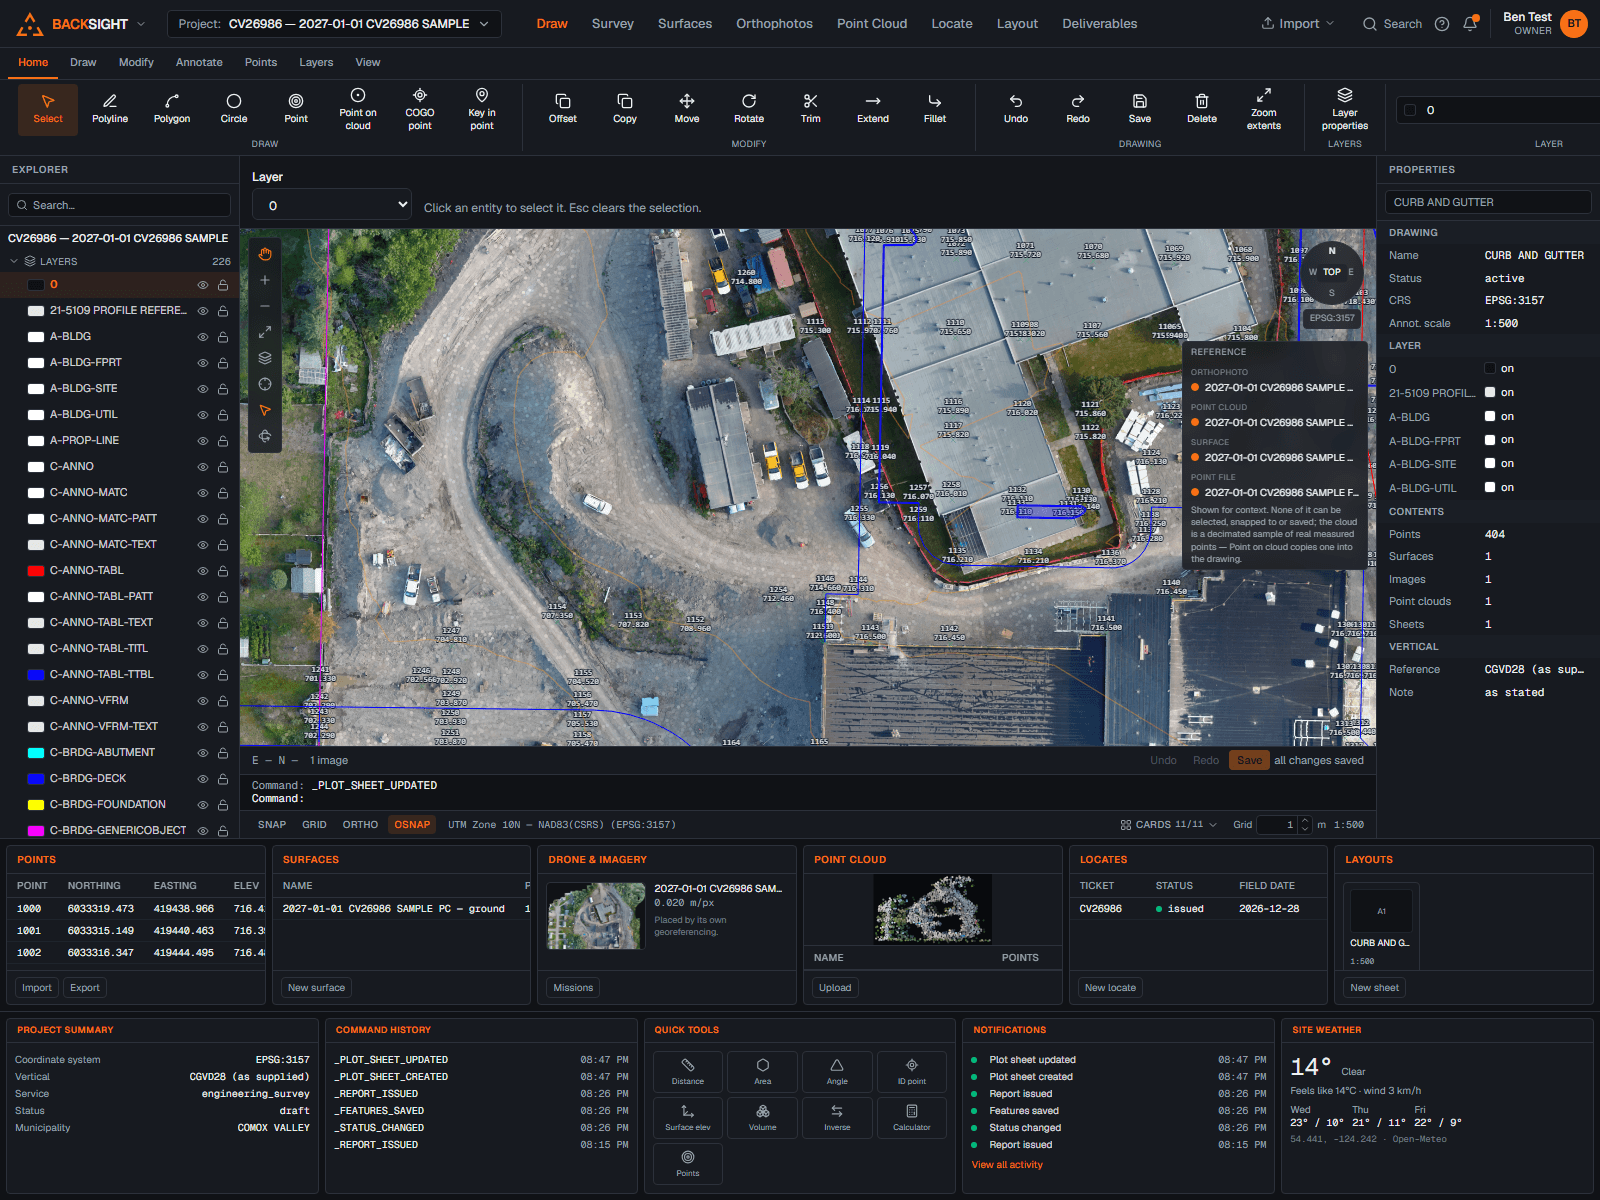
Draw mode is the CAD canvas. A project starts with no drawing: open the Backsight menu (the wordmark, top left) and choose New drawing, name it, keep the project's coordinate system, Create.
- Pick a tool from the ribbon, Polyline, Circle, Point, or type its alias on the command line and press Enter.
- Click on the canvas to place vertices. Double-click, or press Enter, to finish.
- Press Esc to cancel anything in progress.
- Click an entity to select it; its properties open on the right, where you can change layer, colour, linetype and labels.
- Ctrl+Z undoes. Save writes it to the project.
The command line is faster than the ribbon
Type a letter anywhere and the command line takes focus. L for line, O for offset, DI for distance, Z to zoom. Enter on its own repeats your last command.
4. Build a surface
- Switch to Surfaces mode.
- Choose New surface, and pick where the points come from under Points from, the drawing's layers or an imported point file. A point cloud builds its ground surface from its own page, and the panel links you there.
- Add breaklines if you have them: they are enforced, so a ridge stays a ridge.
- Build. You get a triangulation, its statistics and its extent.
- Contour it, drop spot elevations on it, or measure a volume against it.
5. Plot it
- Switch to Sheets mode.
- New sheet: choose a size, an orientation and a scale.
- Fill in the title block, drawing title, client, project number, date, who surveyed and drew it.
- Watch the live preview: it shows the sheet at true proportions, with your logo and legend where you place them.
- Plot to PDF. The file is kept with the sheet exactly as it read, and a checksum, so you can prove what you issued.
Note
A sheet plots at its stated scale, never stretched to fit. The panel tells you how much ground the viewport covers before you plot, and counts anything falling outside it.
Where to go next
- The workspace tour, what every part of the screen is for.
- Choosing a coordinate system, the decision everything else rests on.
- Importing survey points, column mapping, description keys, what gets refused and why.
Read next
- The workspace, part by partOne frame for the whole job: modes, ribbon, explorer, properties, command line and data panels.
- Choosing a coordinate systemThe one decision everything else rests on, and how to be sure you have it right.
- Importing survey pointsGet a points file in, map the columns, and know exactly what was accepted.
Something here wrong or missing? Tell us and we will fix it.